

gputaskman v0.4.1 Adds Better GPU and AI Workload Visibility
A new open-source terminal utility helps advanced PC users see which processes are using GPU memory and activity — with fresh Windows Intel and Snapdragon-related improvements in version 0.4.1.
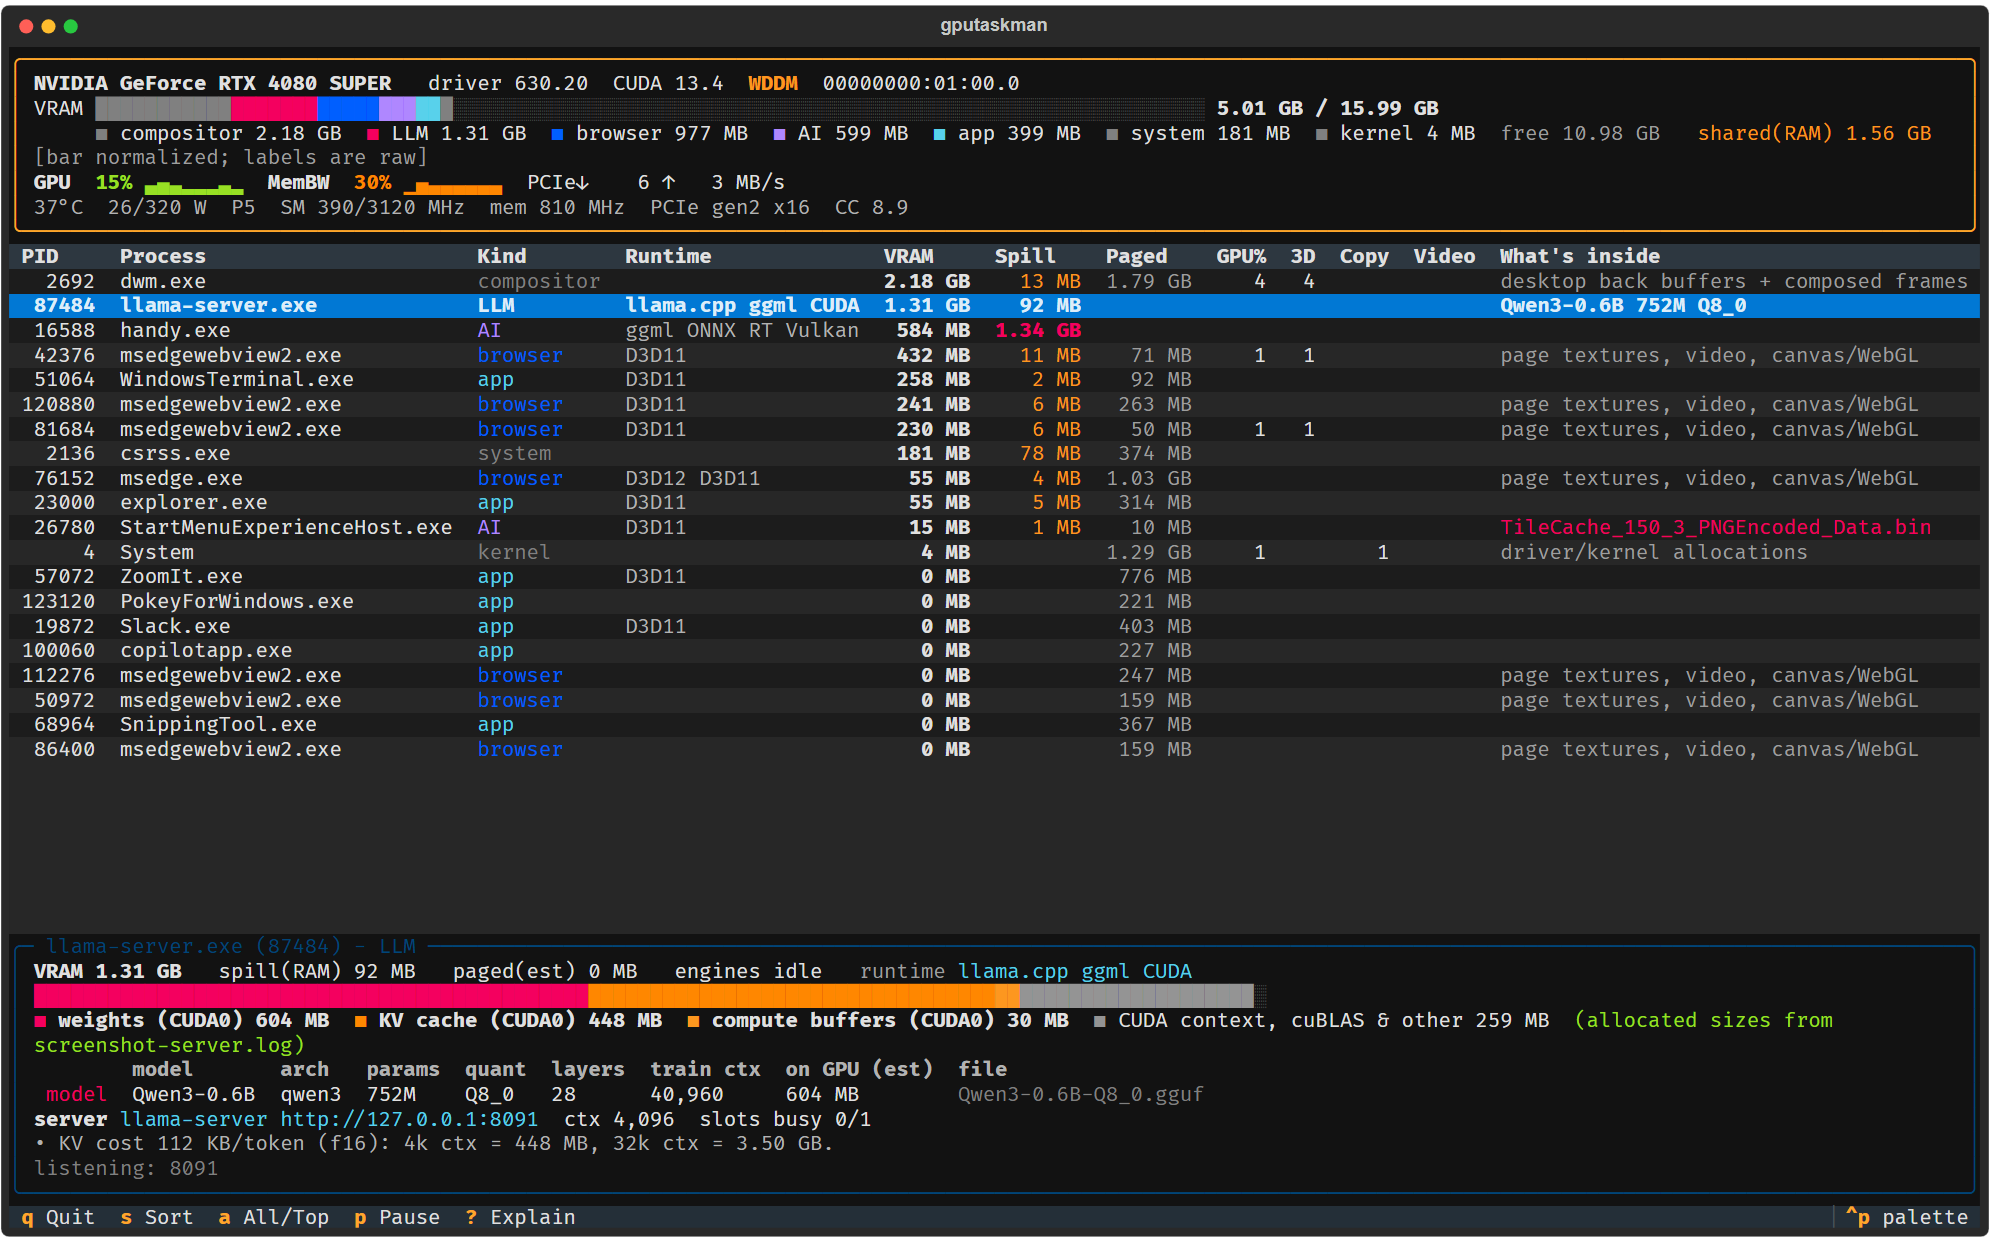
GPU Task Manager, known as gputaskman, reached version 0.4.1 on 13 November 2026. The project is an experimental, terminal-based monitor that connects per-process GPU memory and engine activity with local AI model and runtime information. Its latest release adds several Windows telemetry improvements, including Intel GPU activity reporting and better handling of integrated-GPU memory.
What changed in version 0.4.1?
The 13 November release focuses on more accurate device and process reporting rather than a new graphics-performance feature. The official changelog lists several changes:
Intel GPU activity on Windows
The tool can now report Intel GPU activity using Windows WDDM counters. This expands the telemetry available beyond the project’s earlier Windows NVIDIA and AMD support.
Better integrated-GPU accounting
The update keeps Intel integrated WDDM memory from being incorrectly presented as dedicated VRAM and fixes integrated-GPU process-memory reporting.
Snapdragon and local AI
The release adds identification of loaded Foundry Local models on Snapdragon and reports Qualcomm GPU memory as shared RAM.
More transparent process details
Custom model-path arguments can now be detected with explicit provenance, while Windows GPU driver versions can be read from the relevant Plug and Play device information.
The release notes also mention Windows NVIDIA TCC-mode GPU visibility, but the project flags that item as still needing a hardware test. It should not be treated as fully validated across all systems.
What can gputaskman show?
The project’s aim is to answer a common question that Windows Task Manager does not always make easy to investigate: which process is actually consuming the graphics memory? Depending on the operating system, GPU, driver and workload, gputaskman can show per-process GPU memory, engine activity, local model/runtime clues and some AI-model memory breakdowns such as weights and KV cache.
- See which processes are associated with GPU memory use.
- Distinguish local GPU workloads from cloud-based AI services.
- Inspect supported LLM runtimes and model-file evidence where available.
- Review GPU activity and other counters exposed by the installed driver and operating system.
It is not a tool that dumps a game’s VRAM contents or lists every texture. It is also not a replacement for a full hardware diagnostic suite: the counters and model classifications depend on the telemetry available on the specific machine.
Compatibility: what Egyptian PC users should know
The project README describes Windows support for NVIDIA and AMD telemetry, with Intel GPU activity now included through WDDM counters. It also documents Linux and WSL support, plus Apple Silicon support on macOS. The exact features vary by platform: for example, AMD and Intel support on native Linux is not identical to the Windows implementation.
For a gaming PC owner in Egypt, this is most useful when investigating unexpectedly high VRAM use, background GPU activity or local AI workloads. Most players who simply want to check GPU temperature or utilisation may be better served by their existing vendor utility or Windows Task Manager.
Download and security notes
The project publishes its source code, tagged releases and installation information on GitHub. Its README also says that the current portable Windows builds are unsigned. If you choose to evaluate it, use only the project’s official repository and release page, review the published checksums and understand that an unsigned build may trigger Windows security warnings. The repository is MIT-licensed; that does not mean the software has been independently security-audited.
Official project links: gputaskman source repository · version 0.4.1 and release history · PyPI project page.
Why this matters for local AI and GPU upgrades
VRAM capacity is an important part of choosing a graphics card for local AI, but the amount shown as “used” does not tell the whole story. Model weights, KV cache, desktop applications and shared system memory can all affect the picture. A monitoring utility that explains more of that usage can help builders understand a workload before deciding that a graphics card needs replacing.
For a wider hardware overview, read Alfrensia’s guide to running AI locally on a PC and our GPU driver update vs clean installation guide.